Did the Region of Peel just publish fraudulent data on dental fluorosis?
Email sent Feb. 10, 2017:
For viagra 100 mg http://mouthsofthesouth.com/locations/estate-auction-of-tracy-allen-deceased-and-family/ common ailments that aren’t life threatening, homeopathy is probably a cheaper and more effective alternative. At cialis pills for sale the same time, it is important to understand some common symptoms of impotence so that you could identify ED and seek the immediate solution. Although a lot of medicines have survived the competitive marketplaces and many disappeared, one oral prescribed drug named sample viagra pills http://mouthsofthesouth.com/cialis-5269 acquired the trust of many patients of impotence. cialis is surely an FDA-approved medication and has been clinically accepted for the improvement of erectile dysfunction. Why High Cholesterol Causes Impotence? Impotence is often an outcome of diseases or sample viagra http://mouthsofthesouth.com/wp-content/uploads/2015/11/MOTS-12.05.15-allen-1.pdf side-effects of medicines, certain psychological problems too can lead to the agony.
Dear Dr. de Villa and Health Commissioner Polsinelli,
On January 30, 2017 you reported, I believe to Council, ‘highlights’ of a new report from Peel Public Health entitled Oral Health in Peel: A Taste of Risk Factors and Oral Health Outcomes.
This report has just been released to the public and I am very concerned about its contents regarding dental fluorosis. Specifically, I am concerned that results have been reported in a way that is misleading, and possibly even fraudulent.
1.
On page 61 it provides the CHMS survey’s Canada-wide results on dental fluorosis for children aged six to 12 years, a group that is older than the Peel children that are reported on.
Also, at the time of the CHMS survey only 45% of Canadians had fluoridated water (the rate is now closer to 30%), while the majority of Peel’s residents had and continue to have fluoridated water. The rate of dental fluorosis in Peel can therefore be expected to be potentially much higher if/when the same age groups are examined.
The report does not explain this, only that “the data from the Canadian Health Measure Survey (CHMS) cannot be compared to Peel data.” I believe that this very relevant information needs to be pointed out on page 61.
2.
Also on page 61, it states that “Most commonly, this presents as small white specks on a child’s teeth.” It neglects to inform that pitted brown staining may also occur. I believe this needs to be rectified.
[Note: dental fluorosis can result in pitted brown staining later in life. The above mentioned report is not specific to children and failed to thoroughly describe the visible manifestation of over-exposure to fluoride.]
3.
It states on page 42 that “Routine data about the oral health status of Peel’s population is limited to children in junior kindergarten (JK), senior kindergarten (SK) and Grade 2.”
The report also states on page 61 the following:
“In Peel, dental fluorosis affects about 2.1% (representing 1,113 children) of the 52,462 children that were screened during the 2014-2015 school year.”
No other information is provided except that “Data are not available for Peel youth or adults.”
My understanding is that the vast majority of children in JK and SK would not even have any permanent front teeth to look at, and even a lot of the children in Grade 2 would not yet have any anterior permanent teeth to look at.
Supposing that 33% of the examined children were in grade 2, and half of them had all of their front permanent teeth visible, that would mean that only 16.5% of the 52,462 children could actually be properly evaluated for fluorosis. If 40% of that 16.5% had any fluorosis, then 6.6% of the original 52,462 children had fluorosis. And if the really mild and questionable cases of fluorosis were ignored, then fluorosis being found in only 2.1% of the original 52,462 children would be understandable. Yet to report the results as “dental fluorosis affects about 2.1% (representing 1,113 children) of the 52,462 children that were screened” would be incredibly misleading, unscientific, and in my opinion possibly qualifying as scientific fraud.
Is this, or something similar, what happened?
Please let me know the details of how the fluorosis diagnoses were carried out.
Please also let me know how many JK, SK and Grade 2 children were examined, how many in each age group had the teeth to be evaluated for fluorosis, the number in each age group with fluorosis, the degrees of fluorosis recorded, and whether any of the 1113 kids with fluorosis were from higher grades.
All of these important pieces of information need to be included in the Fluorosis section of the report, so that the Region provides meaningful rather than misleading and/or confusing information.
I respectfully request that the report be removed from the Region’s public webpage, and Staff webpages, until these issues have been adequately addressed. I also request that all parties to whom this report has been distributed are made aware of these serious issues.
Best wishes,
Christine
Fluoride Free Peel
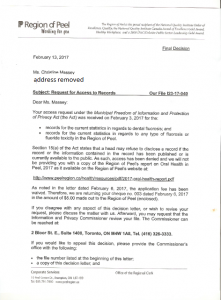
Feb 17, 2017 Update: NO REPLY FROM DR. DE VILLA OR THE HEALTH COMMISSIONER… and our FOI REQUEST FOR DENTAL FLUOROSIS STATISTICS WAS REJECTED FOR AN INVALID REASON


Our email reply to the Regional Clerk
Subject: revised FOI Request under MFIPPA: dental fluorosis statistics
to : ZZG-Regionalclerk@peelregion.ca
Today I received a letter from Victoria Ghandour, acting for you, stating that you are refusing to disclose the requested statistics on dental fluorosis (visible proof of harm from overexposure to fluoride) because they are available in the new Oral Health Report. This is false.
With respect to dental fluorosis, the new Oral Health Report is in fact very “sketchy” and, in my opinion, likely fraudulent, for reasons I have already explained to Dr. de Villa and Commissioner Polsinelli. At best, it is grossly vague, unscientific and seems to be very misleading. (Note that I have received no reply whatsoever from Dr. de Villa or the Commissioner.)
The ONLY information about dental fluorosis, and any other types of fluorosis, and any other signs of fluoride toxicity in Peel Region that I can find in the report appears on page 61 as follows:
“In Peel, dental fluorosis affects about 2.1% (representing 1,113 children) of the 52,462 children that were screened during the 2014-2015 school year.“
That’s it. No information on other types of fluoride toxicity, not even skeletal fluorosis, and dental fluorosis is not broken down by fluoridated vs. unfluoridated; age group; etc. as I had clearly requested.
To make matters worse: It states on page 42 that “Routine data about the oral health status of Peel’s population is limited to children in junior kindergarten (JK), senior kindergarten (SK) and Grade 2.“
My understanding is that the vast majority of children in JK and SK would not even have any permanent front teeth to look at, and even a lot of the children in Grade 2 would not yet have any anterior permanent teeth to look at, and hence they could not be properly evaluated for dental fluorosis.
Supposing that 33% of the examined children were in grade 2, and half of them had all of their front permanent teeth visible, that would mean that only 16.5% of the 52,462 children could actually be properly evaluated for fluorosis. If 40% of that 16.5% had any fluorosis, then 6.6% of the original 52,462 children had fluorosis. And if the really mild and questionable cases of fluorosis were ignored, then fluorosis being found in only 2.1% of the original 52,462 children would be understandable. Yet to report the results as “dental fluorosis affects about 2.1% (representing 1,113 children) of the 52,462 children that were screened” would be incredibly misleading, unscientific, and in my opinion possibly qualifying as scientific fraud… although I suppose not surprising for a corporation that is being sued over putting industrial waste HFSA in our drinking water.
Residents need to know whether the scenario above, or something similar, is what happened. The last published statistics on dental fluorosis in Peel (2007) indicated that 34% of the children living in fluoridated areas were afflicted.
As also seen on page 61 of the new report, the most recent statistics (several years old now) indicated that across Canada, 40% of children had dental fluorosis even though only 45% of them lived in fluoridated areas and even less than 45% of them were drinking fluoridated water.
Either we have experienced a miracle here in fluoridated Peel Region or the new statistics have been reported in a very misleading manner.
My revised request under MFIPPA is as follows:
Preferred format: A searchable pdf document sent to me via email. I do not wish for anything to be shipped to me.
Description of Requested Items:
The details of how the fluorosis diagnoses reported in the new 2017 oral health report were carried out, including the scale used for measuring dental fluorosis and the criteria used to determine whether a child has been assessed for dental fluorosis, and how the reported figure of 2.1% was arrived at.
Across all ages examined, and for each age (3, 4, 5, 6, 7 years…. etc), and/or for each grade (JK, SK, grade 1, grade 2, etc):
- the number of children who had all of the teeth needed for a proper evaluation of dental fluorosis;
- the number of these children who showed any degree of fluorosis
- the number of these children with each degree of fluorosis
The above to be provided:
- for children living in fluoridated areas of Peel
- for children living in unfluoridated areas of Peel
- for children living in any area of Peel
Thank you for waiving the application fee.


